Hi! I‘m
Arnold Rauers.
Since 2012 I create mobile games
with various talented people
as Tinytouchtales.

We've made GUNCHO, Geo Gods, Card Crawl Adventure, Gnomitaire, Maze Machina, Miracle Merchant, Card Thief, ENYO and Card Crawl which are available on the App Store and Google Play.
I publish Game Jam games and showcase my game ideas and prototypes on Itch.io.
If you would like to support me and my work consider becoming a Patron.
You can subscribe to my Newsletter, follow me on Twitter, Instagram or TikTok and join our Discord community.
2018-06-12 - Miracle Merchant
Miracle Merchant Game Of the Day Featuring
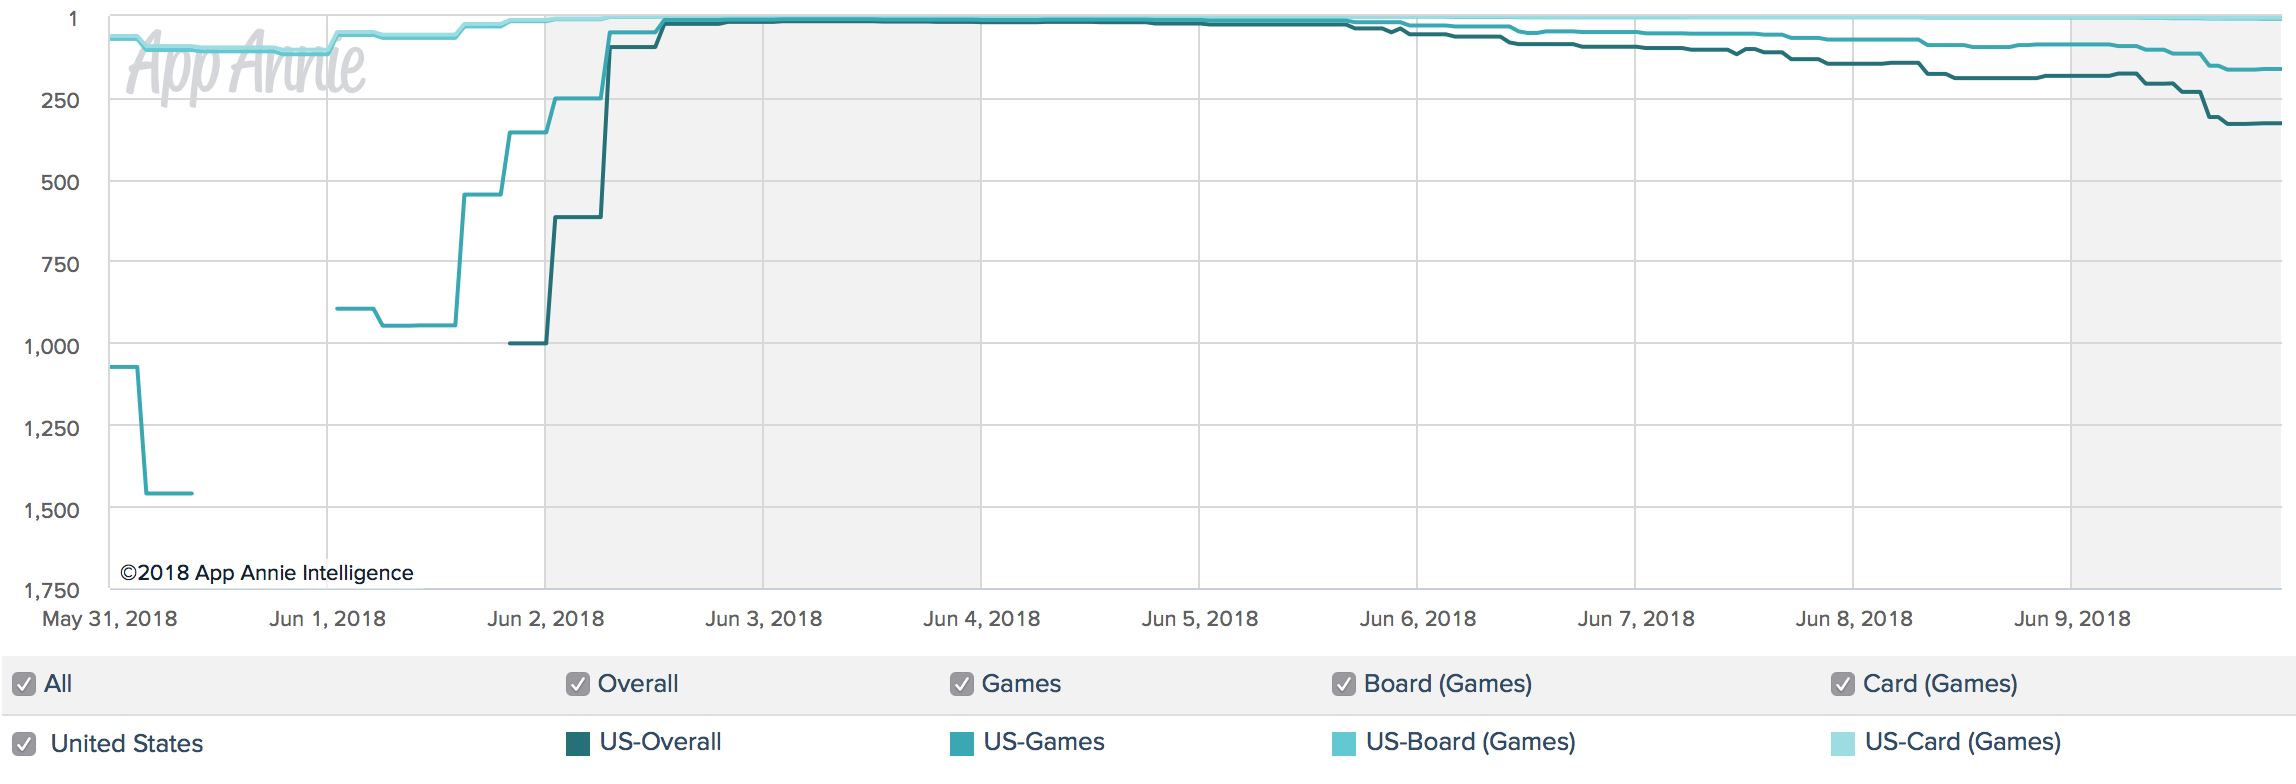
On Saturday June the 2nd Miracle Merchant got the elusive iOS App Store Game of the Day featuring. Here’s a quick look how much impact the featuring had.
— TiNYTOUCHTALES (@tinytouchtales) June 2, 2018
Before the featuring MM average revenue per day was at about $20. It started at rank 950 in the US paid game charts. After the featuring went live MM could climb to spot 11 in the US game charts and stayed there (12/13) for about three and a half days. A week later it already was leaving the top 100 on spot 88. It’s easy to see that the featuring had a huge impact on the sales and ranks and could sustain MM top position for quite some time. What i thought was particular interesting are the download numbers that were needed to get into the top ten and in comparison the downloads needed to stay there. As you can see from the rank/rev relation it seems easier to stay in the top 10 than to get there from rank 950.
On day 1 we needed about 1750 downloads to get from 950 to 11. But it took “only” 950 downloads to move from rank 11 to 13. A day later we made 420 downloads and descended from rank 13 to 15. Here are the graphs, in total we could generate about $5300 directly from the featuring, which is a quite a lot!


